

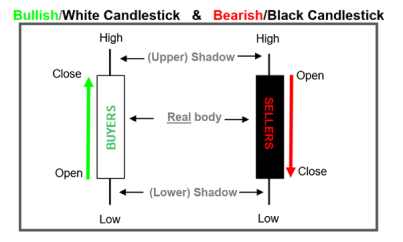
Japanese candlestick charts are a widely utilized method for visual price representation. A single candlestick condenses four key price points over a specified time period: Open, High, Low, and Close (OHLC).
Candlestick charts assist in analyzing price action, trend direction, market volatility, and structural chart patterns. However, neither an individual candlestick nor a technical chart pattern provides a definitive forecast of future price movements.
History of Candlestick Charting
Candlestick analysis originated in Japan, historically associated with 18th-century rice trading on the Dojima Rice Exchange in Osaka.
The methodology gained global adoption due to its ability to display complex market pricing data compactly. Today, candlestick charts are applied across all derivative asset classes, including Forex, Equities, Indices, Commodities, and CFDs.
Key Characteristics
Candlestick charts offer a comprehensive visual overview of historical market dynamics by mapping:
Open Price
Period High
Period Low
Close Price
Technical analysts frequently combine candlestick patterns with supplementary technical indicators, such as Moving Averages, RSI, MACD, Bollinger Bands, and dynamic Support/Resistance levels. Combining multiple technical tools does not guarantee improved predictive accuracy, as outcomes depend entirely on prevailing market conditions.
Price Action & Period Dynamics
A candlestick reflects intra-period interaction between market supply and demand:
If the Close is above the Open, the candle represents bullish price movement.
If the Close is below the Open, the candle represents bearish price movement.
While price action maps market interaction, a single candlestick cannot reveal underlying institutional intent or reliably predict subsequent market direction.
Market Sentiment Considerations
Technical literature frequently references “market psychology” or “trader sentiment” (e.g., fear, greed, or profit-taking). However, candlestick charts strictly represent historical pricing data, not the psychological motives of market participants. Such concepts should be interpreted purely as analytical models rather than established facts.
Candlestick Anatomy
Every candlestick is structured around four primary values:
Open: The execution price at the start of the timeframe.
High: The maximum price recorded during the timeframe.
Low: The minimum price recorded during the timeframe.
Close: The execution price at the end of the timeframe.
Candle Body & Shadows (Wicks)
Real Body: The price range between the Open and Close.
Shadows (Wicks): The lines extending above and below the real body. The upper shadow marks the distance between the period high and the upper body boundary; the lower shadow marks the distance between the period low and the lower body boundary. Shadow length illustrates intra-period volatility relative to opening and closing prices.
CFDs are complex, leveraged financial instruments. Trading on margin involves significant risk of loss.
Available Payment Methods:
Available payment methods may vary depending on account type, jurisdiction and other applicable conditions.