
Alt

Technical analysis

Technical Analysis & Indicators

Technical indicators process historical price data to analyze market characteristics, including trend direction, momentum, and volatility.

Institutional platforms, including MT5, provide access to various technical indicators. Each indicator operates on a distinct mathematical methodology and can be tailored to individual analysis needs.

Technical indicators do not provide reliable forecasts of future price movements and do not guarantee specific outcomes.

Moving Averages (MA)

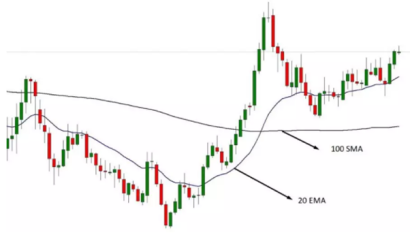
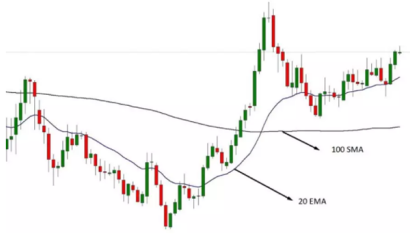
Moving averages smooth price data over a specified period to highlight underlying market trends.

  • Simple Moving Average (SMA): Calculates the unweighted average price over a set number of periods.
  • Exponential Moving Average (EMA): Applies greater weight to recent price data, making it more responsive to fresh market developments.

Prices maintaining positions above a moving average may suggest prevailing upward momentum, while prices below may indicate downward bias. However, MA positioning alone does not dictate future market direction nor constitute a standalone trade signal.

Relative Strength Index (RSI)

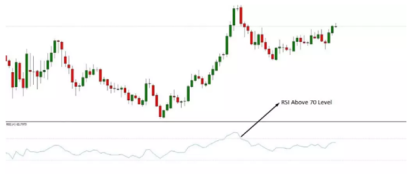
RSI is a momentum oscillator measuring the velocity of price changes on a scale from 0 to 100.

  • Values above 70 traditionally indicate overbought conditions.
  • Values below 30 traditionally indicate oversold conditions.

Overbought or oversold readings do not guarantee a price reversal; during strong trends, RSI may remain in extreme zones for extended periods.

MACD (Moving Average Convergence Diver)

MACD tracks the relationship between two exponential moving averages to evaluate price momentum, trend strength, moving average crossovers, and potential price-indicator divergences. Divergences between price action and MACD values highlight shifts in momentum but do not guarantee trend changes.

Bollinger Bands

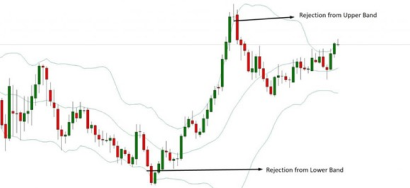
Developed by John Bollinger, this indicator consists of a central moving average flanked by upper and lower bands calculated via standard deviation. Expanding bands signal increased volatility, while contracting bands reflect lower volatility. Band touches or breaches do not independently indicate mandatory price reversals.

Stochastic Oscillator

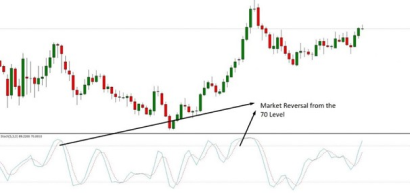
The Stochastic Oscillator compares a closing price to its price range over a specified period (scaled 0–100). Readings above 80 signal overbought conditions, while readings below 20 signal oversold conditions. These zones assist in assessing relative momentum within recent ranges rather than predicting precise pivot points.

Ichimoku Kinko Hyo (Ichimoku Cloud)

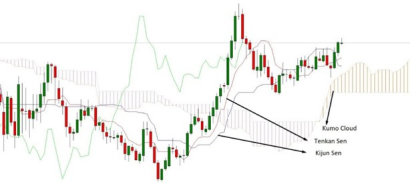
Ichimoku is a comprehensive indicator mapping trend direction, momentum, and dynamic support/resistance levels. Its core components include the Kumo (Cloud), Tenkan-sen, Kijun-sen, Senkou Span A/B, and Chikou Span. Price location relative to the Cloud helps gauge overall market sentiment.

Fibonacci Retracement

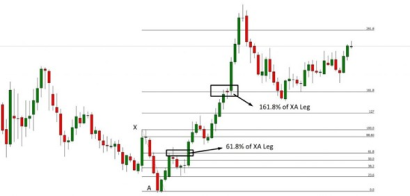
Fibonacci levels (23.6%, 38.2%, 50.0%, 61.8%, and extension 161.8%) identify potential technical retracement or continuation zones. They serve as reference lines for structural analysis and should be combined with broader market context.

Average True Range (ATR)

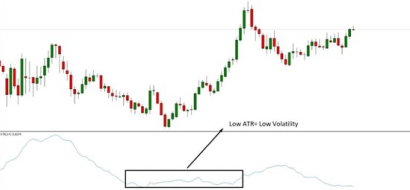
ATR measures market volatility by calculating the average range of price movements over time. Higher values signify expanding trading ranges, whereas lower values indicate consolidation. ATR reflects volatility magnitude, not price direction.

Parabola SAR

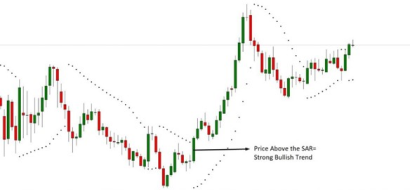
Parabolic SAR plots trailing dots relative to price action to identify potential trend directions and trailing stop zones. Dots plotted below price indicate upward momentum, while dots above signal downward momentum.

Pivot Point

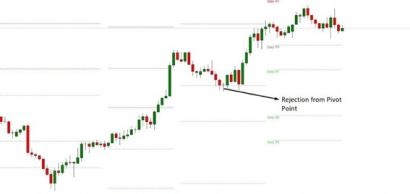
Pivot Points are calculated support and resistance levels derived from previous session high, low, and close prices. They provide structural price landmarks but do not ensure price reactions at specific levels.

Utilizing Technical Analysis

Technical tools aid in evaluating market structure, but combining multiple indicators does not guarantee improved predictive accuracy.

CFDs are complex, leveraged derivative instruments. Position values fluctuate rapidly, and margin trading carries a substantial risk of capital loss.

Alt